On my web server on Amazon Web Services (AWS) I had a T2.micro instance running Ubunto and a web server.
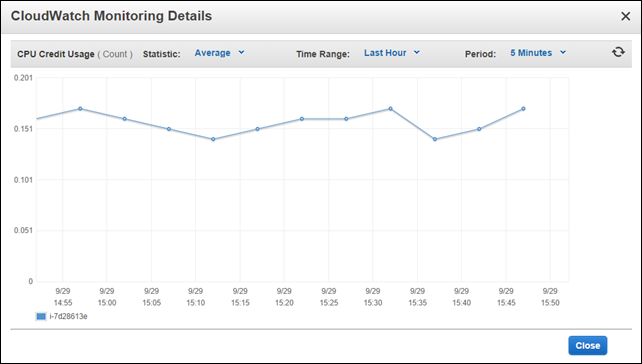
After all installed and up and running I started gazing at the CloudWatch Monitoring charts. Here is one with the default options:
With the help of AWS documentation I recalled the definitions that would help me interpret this graph.
On the AWS documentation at View Amazon EC2 Metrics we can read the explanation about the CPU Credit Usage metrics: “The number of CPU credits consumed during the specified period.”.
So, hovering on the original chart “CPU Credit Usage” I read that, for example, at 2014-09-29 03:19 the server consumed 0.15 credits during 5 minutes, on average. That corresponds to 1.8 credits over one hour. Looking at the graph we can say that the average is about 0.16, which corresponds to 1.92 credits. Let’s assume 2 credits spent in this hour for simplicity.
[…]
Read the full article.
