Purpose
Many web developers have the daunting task of choosing web hosting solutions and company. I needed a low end web hosting for some low traffic web sites. Nonetheless, knowing that it can grow if needed, or how would it support spikes, is also a factor to consider when choosing.
This article focus on the server performance as perceived by the user. I focused on the speed of a hosting for a single visitor and also of its performance for more simultaneous users.
This is not by all means a thoroughly evaluation. There is a lot more that could be done:
- lot more data, better statistical analysis.
- more hosting (companies and plans)
- server internal benchmark software
Other tests
Looking around other hosting speed tests, I’ve found these worth mention:
- 200Please. The “Top Hosting Providers” service analyzed 1,868,360 sites (as of this writing) giving market share and response time for each host of those web sites.
- WPSiteCare. The article “Performance of the Best WordPress Hosting Companies Compared” is very interesting as well as the commenting threads on it.
Methodology
The exact same web site was used in all tests. The site was an instance of the Koken photography free CMS with some photos. As they put it: “Koken is a free system designed for publishing independent web sites of creative work.”. The page I’ve used in the tests was the albums tile page which reads some tables from a mySQL database and show four medium images.
This CMS resizes the previously uploaded photographs to a proper resolution image according to the browser characteristics. It also has a server cache for the resulting HTML page and resized images. From its admin panel one can clear both caches, and this was used on the tests.
One of the main factors in web site performance is the physical distance between the browsing computer and the server computer. My main visitors are located ins Portugal, so a server near Portugal would be wise. The main test server was in Paris, France, since this was the closest to Portugal that was available.
Test Tools
- WebPageTest. The test is conducted using an automated Chrome browser, from a server located in Paris, France. It tests for all speeds of the connection, transfer and render. It’s very similar to the network test inside Chrome Developer Tools.
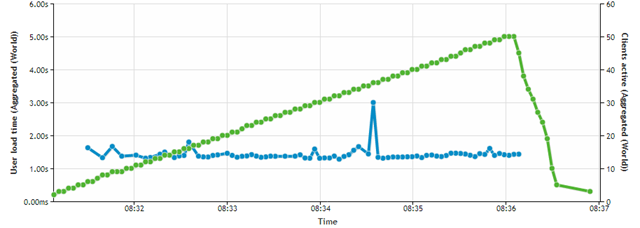
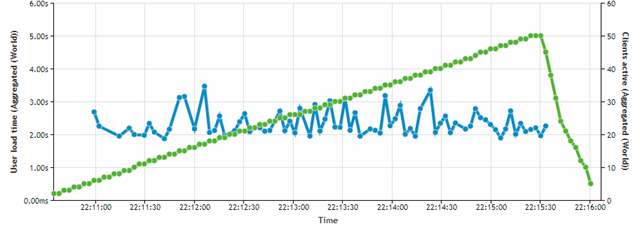
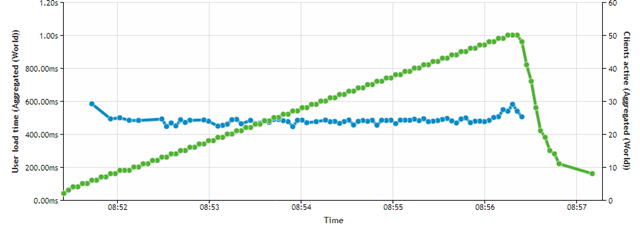
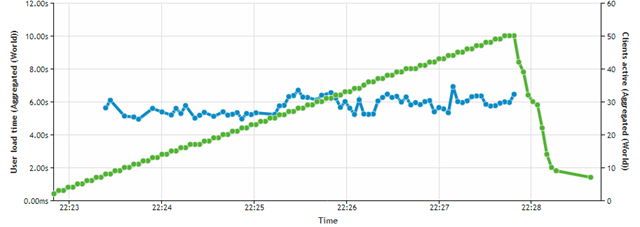
- Load Impact. This tests for server performance when loaded with simultaneous visitors. It gradually goes from 1 user to 50 users. In this test, the actual time reported for a page load is not significant, since the test server is randomly chosen by the site, so the connection time plays a major role there. What matters here is the response to the concurrent users load.
The Tests
- A. Using WebPageTest, 2 runs. After clearing all caches in the Koken admin panel, a test with two runs was fired early in the morning (around 8h, UTC+1). Clearing the Koken cache really tested the server capacity for processing PHP, mySQL access and some server image resizing. So, the first run was CPU intensive, and the second run was “cache intensive”.
- B. Same as test A but in the evening, around 21h, UTC+1.
- C. Load Impact test made early in the morning. Cache is not cleared previously, so it mimics the normal use of the site.
- D. Using WebPageTest, 2 runs. With no cache clearing and the test was the first access in at least one hour (for the 3Essentials is was about 58 minutes). Called it the “cold start” test. The difference between the two runs will tell how it performs when the site was “awaken” or reissuing the same page as in the prior minute. (This test was added later, so its labeled D and not C.)
Measurements
The WebPageTest measures, well, everything for every server request that loading a page involves. But I was interested in these measurements:
- Initial connection time.
- PHP processing with access to local database. There are two requests in this category: the main HTML for the albums page and a generated CSS file (from a Koken “lens” theme file). I used the “time to the first byte” measure.
- Static files. The sum of the times to first byte of two CSS files.
- Image Processing. The sum of the times to the first byte of the four generated (resized) images.
- Full page load times. These times were presented diminished from the initial DNS lookup time, since this varies a lot, and does not depend much on the server characteristics.
- Some of the same measures above but with server cache in use.
- Transfer speed. The sum of the times that the 4 images took to transfer.
The Test C tells the server load capability. There is no quantified measure for this capability but comparing the curves on the charts produced by Load Impact, it is easy to evaluate the server performance. On these charts I didn’t really care for page load times, since the browser world location was randomly chosen and connection times play a major role in page loading times (with more than one or two requests per page, which is the case).
Hostings
The hosting services includes managed and unmanaged VPS. All with similar pricing plans. The idea was to try to know how these compare. Of course the VPS has the hurdle of being unmanaged, and since someone has to do that job, it can be accounted as an additional cost.
| Host | Type | Plan | Cost/mo | Location | Versions | Memory + Swap | Keep-Alive |
| 3Essentials | Managed | Linux PHP Economy | $9 | NC, USA | PHP 5.4, Apache, mySQL 5.1 | 6GB + 6GB | Off |
| MediaTemple | Managed | Grid-Service | $20 | CA, USA | PHP 5.3, Apache 2.2, mySQL 5.1 | 16G + ? | On |
| Azure | Managed | Web Site, Shared | €10.80 | West Eur | PHP 5.4, IIS8.0, mySQL 5.0 | 1GB + ? | Off |
| PTWS | Managed | Linux Starter | €8.9 | Portugal | PHP 5.2, Apache, mySQL 5.1 | 24GB + ? | On |
| DigitalOcean | Unmanaged | 512MB | $5 | Netherlands | PHP 5.5, Apache 2.2, mySQL 5.5 | 512MB + 0 | On |
| DigitalOcean2 | Unmanaged | 1GB | $10 | UK | PHP 5.5, Apache 2.2, mySQL 5.5 | 1GB+ 0 | On |
| AWS | Unmanaged | EC2 T2.micro | $10 + $0.11/GB (storage) | Ireland | PHP 5.4, Apache 2.2, mySQL 5.5 | 1GB + 0 | On |
| Azure2 | Unmanaged | Compute A0 Standard | €10.80 | West Europe | PHP 5.4, Apache 2.2, mySQL 5.5 | 540MB + 512MB | On |
For all unmanaged hosting plans the number of CPUs was one, all running CentOS 6.5 with the Webuzo free control panel installed.
For the managed plans the resources are setup by the hosting and are undisclosed by 3Essentials and PTWS. Media Temple explicitly implements a resource management strategy where a website can be allocated a lot more CPU power, as needed.
All servers report 128MB for the limit of PHP memory that a script can consume, except Media Temple which reports 99MB.
The reason for 3Essentials to be included, as it is a lesser known company than the others, is that it has been my hosting provider for many years.
For all servers I did several runs of the same tests and on different days or with about one hour apart, until I had at least two runs with similar data or without glitches. Over the several runs of the same test, some servers produced data stable enough that I included them only once in the result charts. That is why some servers have several of the same tests shown in the charts bellow and others have only one.
I had also setup Site5 “hostPro” but I had to exclude it from the results since it was unable to generate the images consistently. For most of the requests it gave server errors 500 and 404. Even tried to change the PHP version from 5.3 to 5.4, but it was the same. This was the setup:
Site5 (Managed, hostPro):
- Cost (monthly): $11.95/mo
- Server location: London, UK
- Versions: PHP 5.3/5.4, Apache 2.2, mySQL 5.1
- Memory: 48GB + 6GB swap
- PHP Memory Limit: 256MB
- KeepAlive: On
The hosting on Azure (managed, Shared) was using a free mySQL database with the maximum of 4 connections simultaneously. Although this seems very low, there were no errors in the concurrency test.
Results: Connection Time
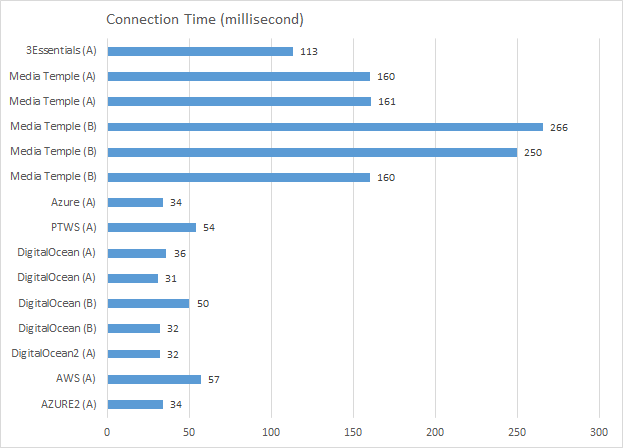
As expected the connection time varies according to the location of the server and the client. 3Essentials and Media Temple are both serving from the USA and the others from western Europe.
Results: PHP Processing
This chart shows the main PHP page processing (in orange) and the “lens” file processing (in blue), also in PHP.
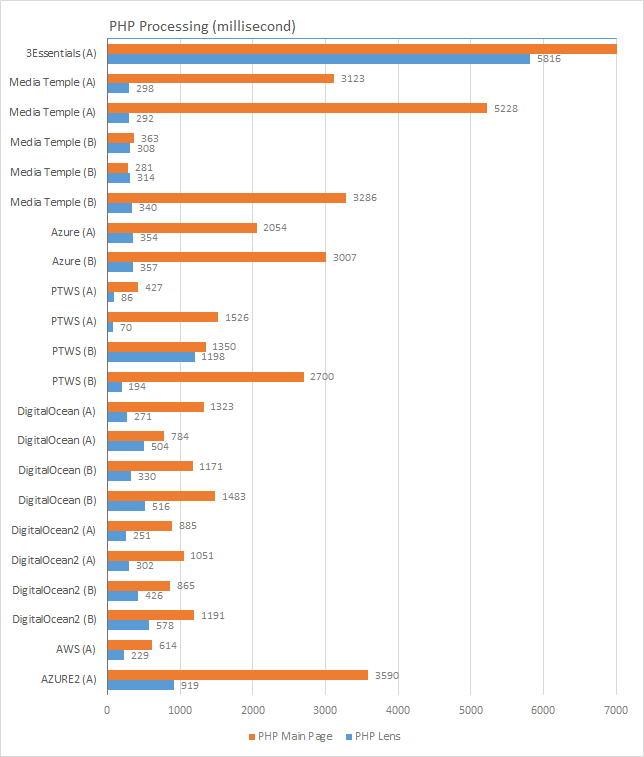
3Essentials is out of the chart since it took, consistently, about 32 seconds to generate the main PHP page! The consistency can suggest that the resources are well limited and so we cannot consume that much CPU. The good side of this is that other neighboring machines cannot affect us that much too, by the same reason. The opposite of this may well be the problem with others managed services, since their inconsistency is notorious: Media Temple, Azure and PTWS. The performance of 3Essentials put their plan out of consideration for hosting this site, but the other plans offered by 3Eessentials might have different resource limits and so can perform differently.
Azure2 plan has a “0.25 CPU” power and a limited disk access speed (max 500 IOPS). The CPU limitation might explain its poor performance here. Although it gave out consistent results indicating it may always have that CPU allocation, which maybe good for some scenarios: its somewhat slow but never too slow.
AWS is the winner here considering both speed and consistency! Only PTWS have better times, but big inconsistencies. Now, one have to remember that AWS was this speedy because it could devote a whole CPU core to those requests. But this will not be the case if your site augments in processing, since that is limited over time. Check how the T2 instances work on Amazon Web Services. Since this photography site uses cache extensively and the number of visitors is rather low, CPU limitation should not be a problem for now. But that should be measured and monitored, and AWS gives you the tools to do so.
Results: Image Processing
The following chart shows the sum of processing (resize) the four photos on the web page.
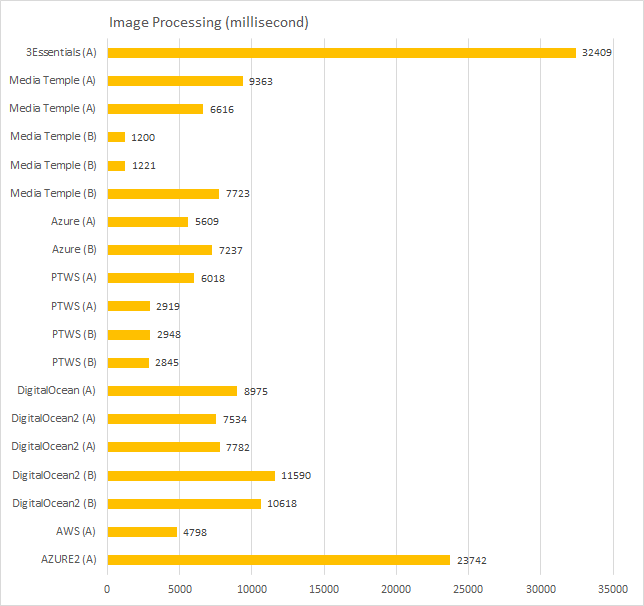
The intensive CPU usage on this test reinforces the conclusions of the previous chart.
Results: PHP Processing – Cached
The following chart shows the two main PHP pages like the chart above, but using cache mechanisms.
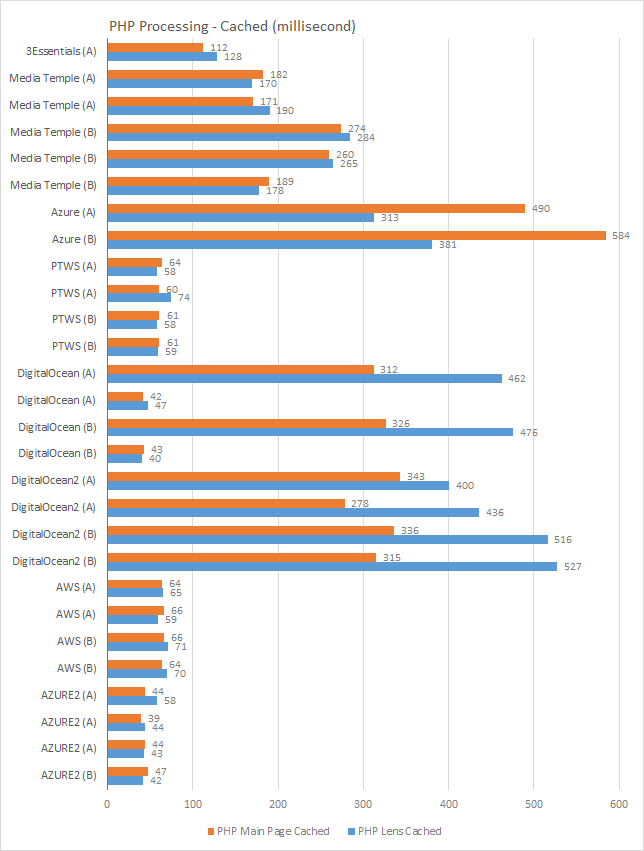
When cache is involved (there is no access to database) the performances are quite different.
The DigitalOcean and DigitalOcean2 are quite strange. Namely comparing cached with non-cached! I cannot understand what is the reason for this. One of the possibilities is that something was misconfigured somewhere in the server software. Or the virtual machine neighbors are so fluctuating that the results are perceived as with a random factor.
One thing stands out: 3Essentials and PTWS are much stable now. I guess it was the database access that made the PHP Main Page (without cache) performance so variable.
Once again the AWS stands out as stable and now Azure2 is much better, being the fastest on average.
Results: Image Processing Cached
This chart show the same timings of the Image Processing above, but now the images required are cached. It should be a straightforward operation.
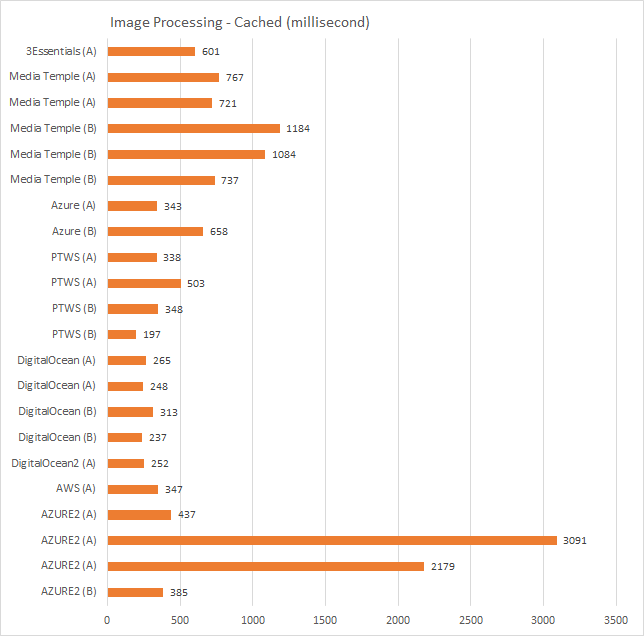
The unmanaged servers show better timings than the managed services. The Azure2 shows some spikes that were in only one of the four images, but occurred randomly across time and images. Perhaps the 540MB (plus swap) of memory was too limiting, although DigitalOcean also had only 512MB (without swap!) and performed reasonably.
AWS continues its consistency quest. And 3Essentials follows right along in the same quest.
Results: Page Loaded
The following chart shows the timings for full page load, including the four images. It was discounted the initial DNS lookup that blocks all communications start.
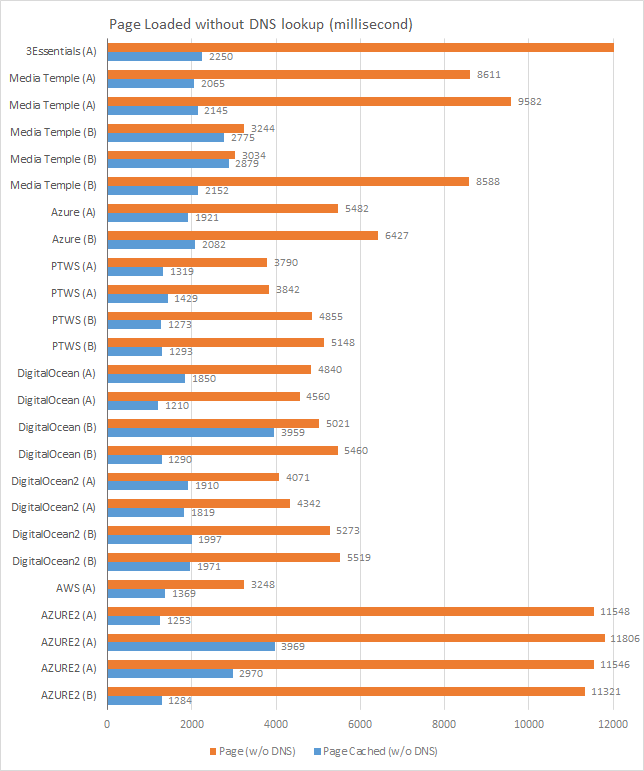
Although one can see this chart as the “real world scenario”, I can not see it as such. There are a lot of factors that came into account in here making difficult to attribute the different timings to the hosting service. Namely, these timings account for services not hosted in the evaluated services, like Google Analytics and jQuery. Also I’ve noticed that, for some tests, there are periods of time that the test browser is not processing any network traffic, liked it has halted for a small period of time. Probably this is due to the test machine being also a virtual machine that is running in parallel with other virtual machines.
So, this chart only serves as a rough comparison between the different services. Nonetheless, it confirms PTWS and AWS as leaders with consistency and speed.
Results: Transfer
For every service, I inspect three tests from types A and B and collected the transfer times of the four images on the page, in milliseconds. The following chart shows the average and standard deviation of the three sums of those times.
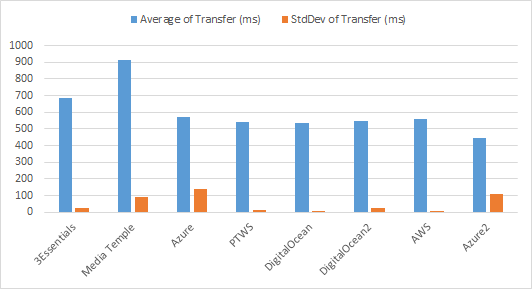
Except for Media Temple, the values are very similar. Although the stability of the values (measured by the StdDev) are significantly different!
Results: Concurrency
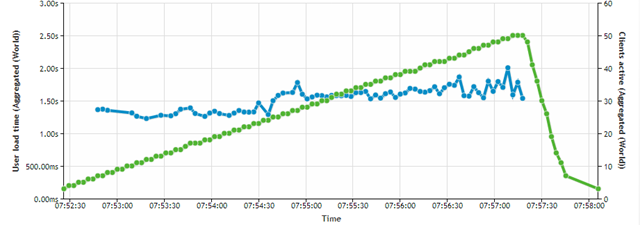
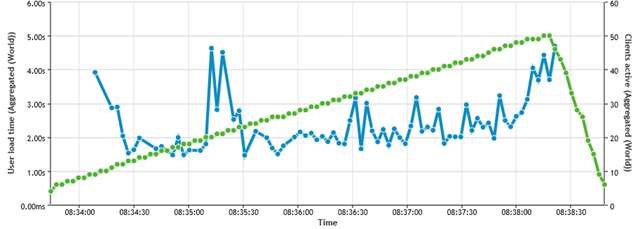
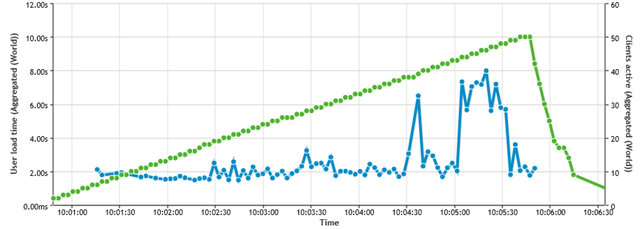
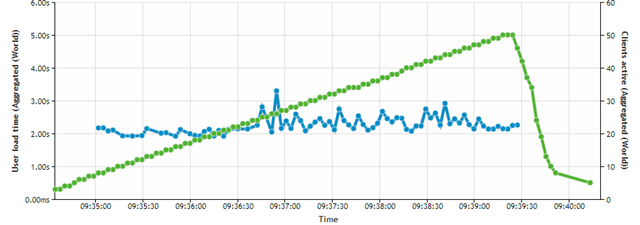
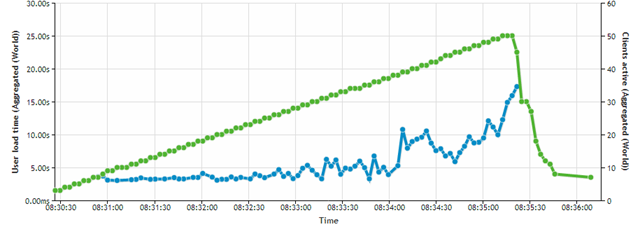
The graphics speak for themselves, where the green line is the number of simultaneous users, and the blue line the time the site takes to respond requests.
3Essentials (C)
MediaTemple (C)
Azure (C)
PTWS (C)
DigitalOcean (C)
DigitalOcean2 (C)
AWS (C)
AZURE2 (C)
The managed services behaved nicely, meaning their resources are allocated as needed.
The 3Essentials performance bugs me. Earlier I suspected that the resource growth was not readily available to a 3Essentials hosted site as it would be required, since it took overly too much time processing images from scratch. But now it behaves nicely. The main difference here is that this concurrency tests do not use image processing nor access the mySQL database. These are some light processing and much disk access. Indeed, 3Essentials performed fairly good on the “PHP Processing – Cached” test above. So, there is limited CPU resource for intensive processing, but not scaling out user access. The reason for not understanding this is surely my lack of deep knowledge of (virtual) server infrastructures.
The DigitalOcean is also a strange case. Moreover since the second server (DigitalOcean2) used the same image as the first server, but on a 1GB RAM plan. Also, DigitalOcean was on Netherlands and DigitalOcean2 on UK. Those are the main differences. Another difference I can think of is that DigitalOcean2 had the Webuzo control panel reinstalled because of the IP change. As you can see I took two tests of DigitalOcean2 and they are both strange. Not sure what to think, although both DigitalOcean plans were having inconsistent results all along, so no surprise here.
AWS performs good once again and Azure2 performs well, that is, as expected by a server that is announced as having a fixed processor power and a limit to the disk access speed.
Results: Cold Start
The following chart show the ration between loading times of the page HTML main file. The value around 1.0 means they were both the same, value greater than 1 means the first run took longer than the second run.
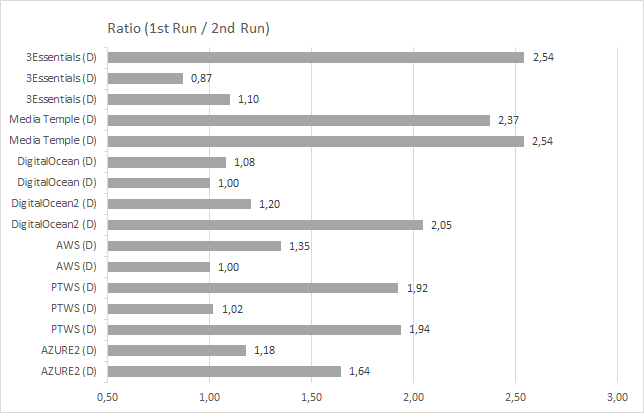
By looking at these values, mainly their variability, I say that the “cold start” effect is not notorious in any of the services, except for Media Temple which shows a consistent double time between the first run and the second one.
Tests Data
- 3Esssentials (Managed, Linux Economy): A A B C D D D
- Media Temple (Managed, Grid-Service): A A A B B B C D D D
- Azure (Managed, Shared): A B C C (after server restart)
- PTWS (Managed, Linux Starter): A A B B C D D D D
- DigitalOcean (Unmanaged, 512MB): A A B B C D D
- DigitalOcean2 (Unmanaged, 1GB): A A B B C C D D
- AWS (Amazon Web Services) (Unmanaged, T2.micro): A A B B C D D
- Azure2 (Unmanaged, A0 Standard): A A A B C D D
Conclusion
The “Connection Time” chart clearly tells me that I should not consider the USA hosting services. In fact the values for Media Temple are conclusive, but the values for 3Essentials might be bearable if there is not much of sequential file loading (files that are referenced by other files in cascading dependencies).
Koken automatically provides images with the right resolution for the viewing device. So, image resizing might occur any time. This really make a huge difference in the conclusion path. If there was no image resize (or occurred only upon image upload) the site would normally operate as measured by the “cached” tests (“PHP Processing – Cached”, “Image processing cached”). In this scenario PTWS and AWS would be good bets. But the scenario is not this one: image size occurs not that few times.
I’ve tried accessing the test page using more devices, like an Android tablet and phone, and the images started appearing in the servers cache. I used an Android tablet, a phone and simulated devices on Chrome and IE11. The files I got in the cache, for one of the images:
20020119-183035-s004247-v0f,100.67.80.60.crop.2x.1404251924.jpg
20020119-183035-s004247-v0f,300.200.85.60.crop.1404251924.jpg
20020119-183035-s004247-v0f,300.200.85.60.crop.2x.1404251924.jpg
20020119-183035-s004247-v0f,440.293.85.60.crop.1404251924.jpg
20020119-183035-s004247-v0f,456.304.85.60.crop.1404251924.jpg
20020119-183035-s004247-v0f,456.304.85.60.crop.2x.1404251924.jpg
It’s not feasible to force filling in the cache for most of devices when uploading a photo. And so, the hosting service must account for making some resizes when needed.
Having this established, we must look also into the non-cached image processing tests although most of the access will use image server caching. The PHP main page processing will likely be using the server cache really most of the time, since it does not depend on the browser.
Focusing on the charts: “PHP Processing – Cached”, “Image Processing” and “Image Processing – Cached”. The PTWS and AWS are the winners, although AWS is more consistent. The concurrency tests maintain that outcome.
Glad that there are a managed and an unmanaged solution in the winners, so one can pick on the service type more suited to its technical knowledge (or time availability!).
Next step
After choosing a hosting service, the next step is to monitor it. I can think of three monitoring approaches:
- Uptime. In terms of service availability. This must be monitored externally to the hosting server.
- Services health and performance. Monitored from inside the server, will check on CPU, memory, disk and server services like the web service.
- Site performance. Check how the website is responding to users compared to a pre-defined performance.
The outcome of this monitoring is indeed what should trigger the change from a current service to a new service.
Have fun!
Acknowledgments
Thank you to Eduardo Oliveira (@eoliveira) and Miguel Maio (@miguelmaio) for lending their hosting plans to host my test site.
Disclaimer
Although the data here depicted is true and was collected directly be me, it does not imply that those services will perform again as indicated. I do not guarantee they will perform better, worse or likewise. I could have made errors that drive the conclusions erroneous.
I’m not affiliated with any of the hosting services mentions in this article.
